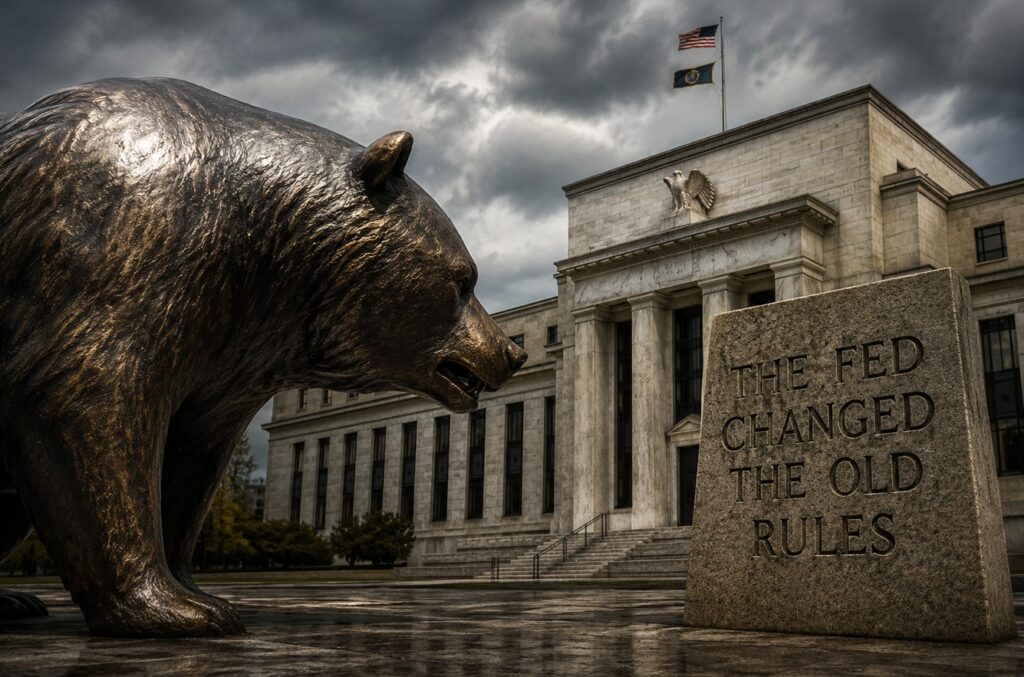
- A bear market is no longer a bear market…
- Some sound advice…
- CNBC called this new Elon Musk opportunity “the big market event of 2026.” Elon Musk is predicting this investment could jump 1,000x higher from here.

Dear reader,
Has the Federal Reserve knocked the stock market so far off its anchorings… that customary guideposts no longer give true readings?
For example: A 20% tumble from the stock market’s most recent heights has for several decades defined a bear market.
Yet the 20% standard entered existence during an era of vastly reduced Federal Reserve excess.
The Federal Reserve’s balance sheet presently bulks several times larger than it has in prior decades.
The quantity of liquidity within the financial system is similarly elevated.
Thus a 20% tumble in 2026 is not the equal of a 20% tumble in 1970.
It’s a Different World
Mr. Lance Roberts of Real Investment Advice:
- The definition of a… bear market [has] not been updated since Alan Shaw developed [it] at Smith Barney in the 1960s. Moreover, the market those definitions were designed to describe no longer exists.
- Currently, the S&P 500 index is roughly 83% above its long-term trend line, with the Shiller CAPE (cyclically adjusted price-to-earnings ratio) hovering near 40. That valuation level was only exceeded once in the history of American financial markets.
- The Fed’s balance sheet, still at $6.7 trillion, is more than eight times its pre-2008 level. Under these conditions, the old bear-market definition no longer measures what it was built to measure.
- A 20% decline from here doesn’t signal either a regime or price trend change. In other words, it would be only a “correction” within an ongoing bullish trend.
That is, a 20% tumble — under today’s extravagant excesses — more approximates a 10% stumble.
A 20% Decline Lacks “Real Information”
Mr. Roberts:
- Shaw’s framework made sense in its time. Markets in those decades lived much closer to a gravitational center of fair value. When prices fell by 20%, they often broke the market’s longer-term trend.
- A decline of that magnitude carried real information. It told you that selling pressure had overwhelmed buying, the market’s price trend had reversed, and the market’s direction of travel had changed from up to down.
- That’s precisely what the bear market definition was supposed to capture. A change in regime, not just a number…
- The question is: after a 17-year-long bull market that stretched prices well beyond long-term trends, is Mr. Shaw’s measure still valid?
Mr. Roberts notes that the bear markets of 2000-2002 and 2007-2009 represented authentic bear markets.
They constituted “a sustained, structural reversal of the prior bullish trend.”
The Point of Departure Into Surreality
Yet the Federal Reserve’s subsequent interventions occurred at such scale… and at such scope… that they reduced all prior reference points to nonexistence.
They twisted the road signs on the route to price discovery.
East became west, west became east. North became south and south became north.
Or did north become west? East become south? The answer was — and is — exceedingly difficult to determine.
And so we can no longer cling to previous reference points.
Continues Mr. Roberts:
- To understand why the bear market definition needs to be revised, you have to reckon honestly with what the Federal Reserve has done to the market’s structural foundation.
- Before the 2008 financial crisis, the Fed’s balance sheet sat at roughly $800 billion. Modest. Stable. Largely inconsequential to equity prices on any given day.
- Then came the crisis. The Fed launched three rounds of quantitative easing between 2009 and 2014, pushing its balance sheet to roughly $4.5 trillion. It tried to normalize beginning in 2018, then COVID hit.
- In two years, the balance sheet more than doubled again, from $4.3 trillion to nearly $9 trillion. As of April, 2026, it still sits at $6.7 trillion, even after years of several years of quantitative tightening.
No Precedent
And what precisely were the consequences?
- It repriced every financial asset upward. It suppressed yields… and effectively forced capital into equities regardless of underlying valuation.
- The market didn’t reach these levels because corporate America suddenly became dramatically more profitable. It reached them because the price of money was artificially held low for over a decade, which changed the math in every valuation model investors use.
- The result is a market structure with no historical precedent for its distance from the long-term trend.
Just so. Yet why does the customary definition of bear market fail us?
In this fellow’s telling, the stock market’s distance from its long-term trend is so vastly extended, a 20% plunge represents a mere portion of the distance to the bear market boundary.
Thus the “bear markets” of 2020 and 2022 were not bear markets. They failed to break the bullish trend line. They were mere corrections.
The New Definition of a Bear Market
Only a 50% or 60% plummet from present heights would haul the market to the bear market threshold:
- A 20% decline from current levels leaves the market at roughly 32x cyclically adjusted earnings. That’s twice the historical median.
- The market doesn’t even begin to approach a valuation floor that has historically supported the start of a new secular bull market until you’re down 50% to 60% from here.
- That’s not a prediction; that’s arithmetic, and the difference between a correction and a bear market in today’s financial markets.
The central difficulty arises when investors — clinging to the customary 20% bear market standard — believe the worst has likely ended.
They will “buy the dip.” Yet they will not realize that customary bear market definition lacks all relevance.
They will not realize that the cycle has not yet completed. They will not realize that the stock market will plunge to depths inkier yet.
Reality Always Wins Eventually
Once again, Mr. Lance Roberts:
- Every bull market is only half of a full market cycle. The second half, the bear, is when the excesses accumulated during the upswing, the overvaluation, the leverage, the speculative positioning, get wrung out through a sustained decline that resets prices back toward fundamental value.
- That process has played out after every major bull market in the historical record. From the 1929 collapse to the 1970s grind, the dot-com bust, and the financial crisis. None of them was optional; they were just the structural corrections of prior excesses.
- The bull market that started at S&P 683 in March 2009 is now 17 years old. It’s the longest on record…
- The distance between current prices and genuine long-term fair value is wider today than at any point outside the dot-com peak…
- But… the underlying valuation math, and eventually, prices will reflect fundamentals. They always do.
As the fellow said: They always do.
Make Sure You Ask the Right Question
And so here is the central question:
- The relevant question isn’t “how far has this fallen?” It’s “how far is this from where prices would need to be for the bull market trend to genuinely reverse?”
- Right now, that gap is enormous. A real bear market, in the structural sense, would likely need to be a 30% to 50% decline, and possibly deeper, before prices would reach the kind of valuation support that has historically ended bear markets and started new secular bulls.
Are you prepared to endure a 30%, 50% or 60% whaling while the cycle fully completes?
If you are nearing retirement — or in retirement and depending upon endless bull market — I hazard the answer is no.
Concludes Mr. Roberts:
- That’s not a reason to be out of the market. It is a reason to know exactly what you own, why you own it, and what your exit plan looks like if the second half of this cycle finally arrives.
There you have sage counsel… I would argue.
Will you heed it?
Regards,
Brian Maher
for Freedom Financial News