- The stock market is “pornographically” overvalued…
- Literally off the charts…
- Robert Kiyosaki’s new warning reveals the shocking truth about the economy they don’t want you to know. Don’t be left behind. Click here to get his urgent action plan now!

Dear Reader,
Precisely how overvalued is the present stock market?
It is not merely overvalued, argues market observer Quoth the Raven.
It is not even vastly overvalued, in his telling.
This Cassandra argues the present stock market is “pornographically” overvalued.
That is, the present stock market is explicitly, graphically and obscenely overvalued.
It violates every last decency… and is unfit for tender audiences.
The Raven quoter bases his pornographic rating — partially at least — upon the Buffett Indicator, so-called.
Obscene
As I have explained previously:
The Buffett Indicator is the ratio of total United States stock market capitalization to the gross domestic product.
If United States stock market capitalization precisely equals the gross domestic product… you have a reading of 100%.
Wall Street and Main Street track perfectly parallel, the one the perfect mirror of the other.
A reading below 100% indicates a stock market undervalued against the economy underlying it.
Stocks are steals.
A reading above 100% indicates a stock market overvalued against the economy underlying it.
Stocks are dear.
What does the Buffett Indicator presently read?
A pornographic 211% — not quite as obscene as June 30’s 217% — yet nearly.
Here is the graphic evidence, in all its fleshy detail:
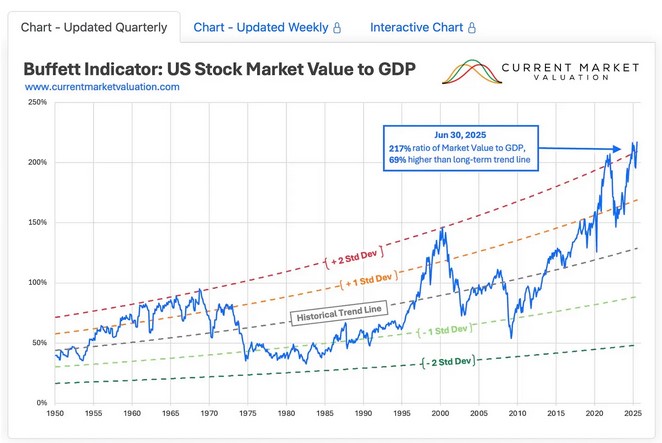
Source: Current Market Valuation, Quoth the Raven
A 40% Correction?
The Buffett Indicator attained 216% in late 2021 — then a record. The stock market soon endured severe “correction.”
Meantime, the famous Buffett Indicator read an x-rated 217% at June’s end.
Quoth the Raven:
When the data screams “bubble,” ignoring it usually doesn’t end well…
- On almost every objective measure, the market is not just expensive — it’s wildly overvalued.
- Take the Buffett Indicator. It’s sitting [above] 200% of GDP, more than two standard deviations above its long-term average. The last two times it got anywhere near this level were the dot-com peak in 2000 and again in late 2021.
- In both cases, investors were treated to drawdowns north of 40%.
Are you prepared for a similar “treat”?
I hazard very few investors are prepared for the treat.
Stretched to the Maximum
In further justification of the pornographic rating, this fellow cites present price-to-earnings ratios.
These concern stock valuations.
Stock valuations are presently stretched to wanton, lascivious, obscene extremes… in a pornographic position decency forbids me to detail.
Here again is the graphic evidence, with its rating of x:
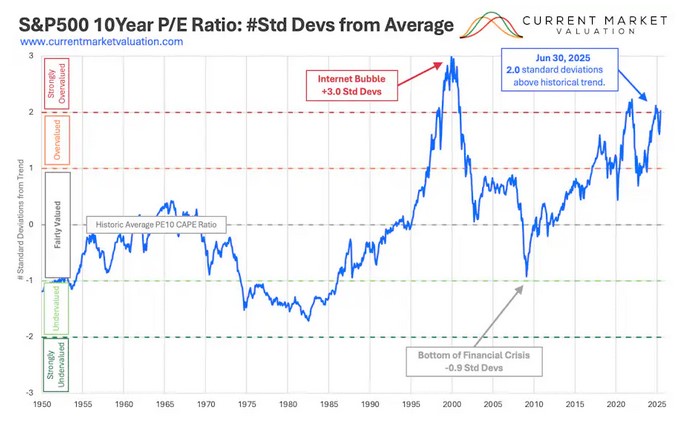
Source: Current Market Valuation, Quoth the Raven
Priced for Perfection
The crackerjacks at Current Market Valuations:
- The current S&P 500 10-year P/E Ratio is [37.87]. This is 80.9% above the modern-era market average of 20.5, putting the current P/E 2.0 standard deviations above the modern-era average…
- P/E ratios can only go so high. To justify a P/E ratio that is consistently above its own historic average for long periods of time, the US stock market must not only continue to grow, but would need to continue to grow at a continuously increasing rate.
Adds Quoth the Raven:
- [P/E] ratio(s) tells the same story: hovering in the mid-30s today, more than two standard deviations above its mean. The only other times it has reached these levels were 1929 and 2000 — and we all know how those chapters ended (spoiler: not with soft landings and champagne).
They ended rather with hard landings and hemlock.
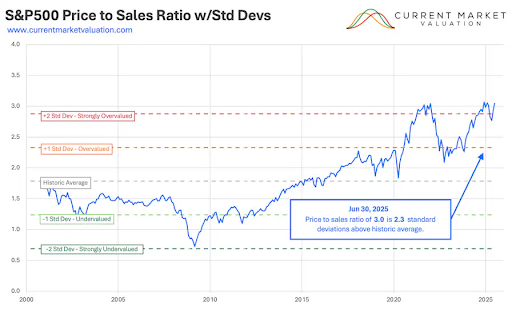
Next we come to another market metric — the price-to-sales ratio.
The price-to-sales ratio values a company is relative to its revenue.
Heavily Out of Whack
Reports Current Market Valuation:
- Since 2000 it has averaged around 1.8. As of June 30, 2025 the S&P 500 Price-to-Sales ratio is 3.1. That value is 2.3 standard deviations above normal, indicating that the market is currently Strongly Overvalued.
Today the price-to-sales ratio registers an even more pornographic 3.23.
Here yet again, in graphic detail:
Source: Current Market Valuation, Quoth the Raven
Literally Off the Charts!
Of the market’s loose virtue, Quoth the Raven laments:
- The price-to-sales ratio is equally stretched. At more than three standard deviations above trend, the market is literally off the charts. That level of multiple expansion has never been sustained. Every time it’s gotten this far — whether 2000 or 2021 — it has unwound violently.
Three standard deviations above trend! Literally off the charts!
How do you like it?
In conclusion:
- When valuations are this far above trend — 1929, 2000, 2008, 2021 — the aftermath isn’t gentle mean reversion. It’s collapse. And every collapse has its catalyst. Maybe it’s a crypto unwind.
- Maybe it’s the Fed boxed in by inflation. Maybe it’s BRICS announcing a commodity-backed settlement system. Maybe it’s peace in Ukraine, perversely, removing the last bullish narrative. Maybe it’s simply the economy slowing under the weight of positive real rates until earnings crumble.
- The point is, with valuations this stretched, the catalyst doesn’t matter. The conditions are already there.
How to Define Pornography
If you are a long-suffering reader of this publication, you are aware that I hazard no predictions — at least not serious predictions.
Today I uphold that venerable, cowardly tradition.
I merely report the weather. I do not report a forecast.
Thus I cannot inform you when the stock market will collapse… the extent of its collapse… or even if it will collapse.
Are today’s stock market valuations truly pornographic? Do they cross the critical threshold?
Once again, I offer no authoritative answer. Yet I cite the late Supreme Court Justice Potter Stewart’s standard for pornography:
“I know it when I see it.”
When I look at the stock market… I see it.
Brian Maher
for Freedom Financial News